Astronomers at the start of the 1900's were in a state of confusion. They realized that stars had a wide range of temperatures, sizes, luminosities, and masses. They had lots of data but very little understanding if/how these quantities were related. They had no knowledge of nuclear processes so they didn't even know what powered our own sun (the very closest star). This was a golden period for the science because things soon took shape.
To help sort things out, astronomers found ways of classifying stars into different categories. One aspect of stars that were grouped into subdivisions was stellar diameters in a category known as luminosity class.
| Luminosity Class | Name | Radius (sun = 1) |
| I | Super Giants | few 100 to about 1000 |
| III | Giants or Red Giants | about 100 |
| V | Main Sequence | 1/10 - 10 |
| wd | White Dwarfs | 1/100 |
Using Wien's Law (looking at the peak wavelength), astronomers realized that stars vary quite a bit in temperature, ... from about 3000K to 40,000 K (and even hotter stars have since been found). The way astronomers classify temperature is a bit strange, but a very short history lesson might help explain how this was done. Early astronomers would look at the absorption spectra of stars and notice great differences in the type, number, and intensity of the various lines present in the stars. They developed a classification system which would assign a letter to stars according to these spectral lines they saw. Astronomers were under the impression that stars differ greatly in their chemical makeup. This is really not true. We now know that stars are mostly hydrogen and helium and differ only slightly in chemical makeup. Later it was discovered that the temperature was the main reason why the spectral lines differed so greatly from one star to another. Rather than change the letters which had already been assigned to the stars, they just decided to understand the meaning of the letters differently. The letters become excellent temperature indicators. This also means astronomers have another way of determining the temperature of a star, - Wien's Law and spectral lines.
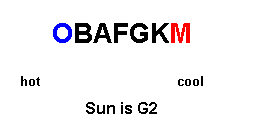
The system became known as spectral class, and the letters most stars are assigned are O, B, A, F, G, K, M (going from hot to cool). Each letter is subdivided using a number from 0-9 (hot to cool), so a B3 star is slightly hotter than a B4 star. Our sun's photosphere is about 6000K (11,000 F). On this scale, it is classified G2.
Let's look again at a list of the brightest stars in the sky.
The Brightest Stars (as seen from Earth)
| Name | Proper Name | Distance (ly) | Apparent magnitude mv | Absolute magnitude Mv | Spectral & Luminosity class |
| Sol | Sun | -26.7 | +4.85 | G2V | |
| Alpha CMa | Sirius | 8.7 | -1.46 | +1.4 | A1V |
| Alpha Car | Canopus | 98.0 | -0.72 | -3.1 | F0I-II |
| Alpha Boo | Arcturus | 36.0 | -0.06 | -0.3 | K2IIIp |
| Alpha Cen | Rigil Kent | 4.2 | 0.01 | +4.4 | G2V |
| Alpha Lyr | Vega | 26.5 | 0.04 | +0.5 | A0V |
| Alpha Aur | Capella | 45.0 | 0.05 | -0.6 | G8III |
| Beta Ori | Rigel | 900.0 | 0.14 | -7.1 | B8I |
| Alpha CMi | Procyon | 11.4 | 0.37 | +2.6 | F5IV-V |
| Alpha Ori | Betelgeuse | 520.0 | 0.41 | -5.6 | M2I |
| Alpha Eri | Achenar | 118.0 | 0.51 | -2.3 | B3V |
| Beta Cen | Hadar | 490.0 | 0.63 | -5.2 | B1III |
| Alpha Aql | Altair | 16.5 | 0.76 | +2.2 | A7IV-V |
| Alpha Tau | Aldebaran | 68.0 | 0.86 | -0.7 | K5III |
| Alpha Vir | Spica | 220.0 | 0.91 | -3.3 | B1V |
| Alpha Sco | Antares | 520.0 | 0.92 | -5.1 | M1I |
| Alpha PsA | Fomalhaut | 22.6 | 1.15 | +2.0 | A3V |
| Beta Gem | Pollux | 35.0 | 1.16 | +1.0 | K0III |
| Alpha Cyg | Deneb | 1600.0 | 1.26 | -7.1 | A2I |
| Beta Cru | 490.0 | 1.28 | -4.6 | B0.5III | |
| Alpha Leo | Regulus | 84.0 | 1.36 | -0.7 | B7V |
| Alpha Cru | Acrux | 370.0 | 1.39 | -3.9 | B0.5IV |
| Epsilon CMa | Adhara | 680.0 | 1.48 | -5.1 | B2II |
| Lambda Sco | Shaula | 310.0 | 1.60 | -3.3 | B1V |
| Gamma Ori | Bellatrix | 470.0 | 1.64 | -4.2 | B2III |
| Beta Tau | Elnath | 300.0 | 1.65 | -3.2 | B7III |
We showed before that these stars appear bright to us because they are (for the most part) extremely luminous (look at their absolute magnitudes). If you recall, the luminosity of a star is a function of the radius and temperature.
Look at Rigel (absolute magnitude of -7.1). This star is luminous because it is both hot (B8) and big (super giant - I). If you look at Betelgeuse you will see a cool star (M2) that gives off a lot of light (-5.6). It does this by having a large radius. If you were to place Betelgeuse in our solar system, it would extend beyond the orbit of Mars (and there are stars even bigger than this). Most of the stars on this list are bright to us not because they are close, but because they are luminous. They are luminous because they are either big, or hot, or both.
Now we turn our attention to a list of our stellar neighbors.
The Closest Stars
| Name | Distance (ly) | Apparent Magnitude mv | Absolute Magnitude MV | Spectral & Luminosity class |
| Sun | -26.7 | 4.85 | G2V | |
| Proxima Cen | 4.24 | 11.05 | 15.49 | M5V |
| Alpha Cen A | 4.34 | -0.01 | 4.37 | G2V |
| Alpha Cen B | 4.34 | 1.33 | 5.71 | K2V |
| Barnard's Star | 5.97 | 9.54 | 13.22 | M4V |
| Wolf 359 | 7.80 | 13.53 | 16.65 | M6V |
| Lalande 21185 | 8.19 | 7.50 | 10.50 | M2V |
| UV Ceti A | 8.55 | 12.52 | 15.46 | M5V |
| UV Ceti B | 8.55 | 13.02 | 15.96 | M6V |
| Sirius A | 8.68 | -1.46 | 1.42 | A1V |
| Sirius B | 8.68 | 8.30 | 11.20 | wdA |
| Ross 154 | 9.52 | 10.45 | 13.14 | M4Ve |
| Ross 248 | 10.37 | 12.29 | 14.78 | M5V |
| Epsilon Eri | 10.63 | 3.73 | 6.14 | K2V |
| Ross 128 | 10.80 | 11.10 | 13.47 | M4V |
| Luyten 789-6 | 11.12 | 12.18 | 14.49 | M6V |
| Groombridge 34 A | 11.22 | 8.08 | 10.39 | M2V |
| Groombridge 34 B | 11.22 | 11.06 | 13.37 | M4V |
| 61 Cyg A | 11.22 | 5.22 | 7.56 | K4V |
| 61 Cyg B | 11.22 | 6.03 | 8.37 | K5V |
| BD +59° 1915 A | 11.25 | 8.90 | 11.15 | M3V |
| BD +59° 1915 A | 11.25 | 9.69 | 11.94 | M4V |
| Epsilon Ind | 11.25 | 4.68 | 7.00 | K3V |
| Tau Cet | 11.35 | 3.50 | 5.72 | G8V |
| Lacaille 9352 | 11.42 | 7.35 | 9.58 | M1V |
| Procyon A | 11.45 | 0.37 | 2.64 | F5IV-V |
Most of these stars are invisible to the eye even though they are very close to us. We already established that these stars put out very little light (about 1/100th the luminosity of the sun, on average). Now maybe you can see why. Most are main sequence (V) and cool (lots of M stars ... occasionally called red dwarf stars). In fact, most of these stars are only about 1/10 as big as our sun. They put out so little light because they are small and cool. This is a "typical" star in our neighborhood.
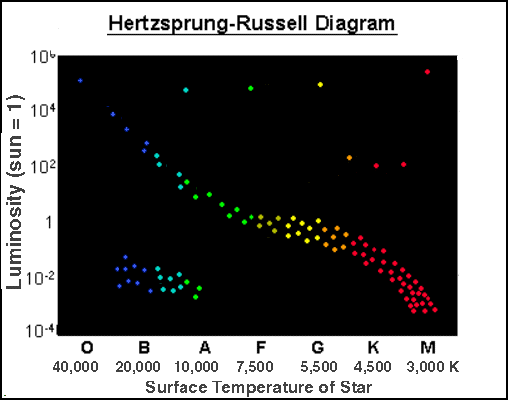
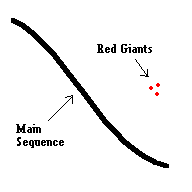
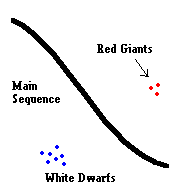
Two astronomers, Henry Norris Russell and Ejnar Hertzsprung, independently made a breakthrough when they plotted all the various stars on a graph. This graph is so important, it is found in every astronomy book since. It is referred to as the Hertzsprung-Russell Diagram (or simply HR diagram).
The HR Diagram (the sun is the flashing star in this animation)
What is being plotted? This is a graph which plots the luminosity (intrinsic brightness) of a star against its surface temperature (photosphere).
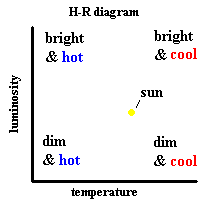
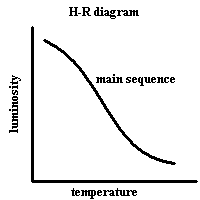
About 90% of all stars (including our sun) lie on the main sequence. When stars are plotted on the H-R diagram, main sequence stars stretch all the way from the upper left corner to the lower right corner in a continuous pattern. Our sun appears around the middle of the main sequence. Not too hot, not too cold, but that does NOT mean our sun is an "average" star. Stars are not distributed evenly along the main sequence. Most stars are main sequence, but most main sequence stars appear in the lower right corner of the HR diagram. That is to say, our sun is slightly hotter and slightly more luminous than most stars in the sky.
As you look at the HR diagram, you will notice 3 other groupings of stars - red giants, white dwarfs, and super giants.
 |
 |
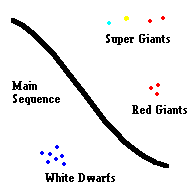 |
White dwarfs make up this next largest group. Approximately 10% of all stars seem to be white dwarfs. Do the math! This leaves very little left for red giants (less than 1%) and super giants (much less than 1%).
After Hertzsprung and Russell created this graph, they knew it was special. Anytime you get stars divided into groups like this, there has to be a reason. The big question is, ... what are those reasons? We solve that in the next section but for now ....
Let's see if we can put everything you need to know about stars to the test (or ON the test)! Consider these five stars (that I made up):
| Apparent Magnitude (mv) | Absolute Magnitude (Mv) | Luminosity Class | Spectral Type | |
| Star A | 0 | 4 | V | F4 |
| Star B | -1 | 5 | V | G1 |
| Star C | 5 | -5 | I | M3 |
| Star D | 11 | 11 | wd | A0 |
| Star E | 3 | -3 | III | B8 |
Question 1: Which star is most like
the sun?
Question 2: Which star is the brightest as seen from Earth?
Question 3: Which star is the hottest?
Question 4: Which star is the biggest?
Question 5: Which star puts out the most light?
Question 6: Which star is
about 10 parsecs away?
Question 7: Which stars are further than 10 parsecs
away (hard)?
Scroll down for the answers
Answer 1: Star B Our sun is a G2 V with an
absolute magnitude of about +5
Answer 2: Star B would be a
very bright star with an apparent magnitude of -1
Answer 3: Star E
is very hot with a spectral class of B8
Answer 4: Star C is
a supergiant with a luminosity class of I
Answer 5: Star C
has an absolute magnitude of -5
Answer 6: Star D since the
apparent magnitude matches its absolute magnitude
Answer 7: Stars C &
E must be very far away since both put out a lot of light (Absolute
Magnitude) but appear rather dim in our sky (Apparent Magnitude). This one
was pretty hard but the idea is if both these stars were placed at 10 parsecs,
they would then have apparent magnitudes of -5 and -3 which would make them (by
far) the brightest stars in the night sky.
PS: Star D is a white dwarf
just in case you were wondering.
©Jim Mihal 2004, 2014, 2020 - all rights reserved